HECupgrade …the future begins…
On these pages we are following the big question:
Which technology shall we use for the next
generation of detectors: GaAs or SiGe?
You may click the next lines to see many tables, diagrams and numeric
results which are concerning the last radiation test made in
Please read the text at the end of the page for short explanations about
the diagrams...
For the production of these
diagrams, tables and other pages I mostly used the following programs: Visual
C++, ROOT, ORIGIN 7.0, CorelDraw 12, Adobe Photoshop 7.0, and LaTex.
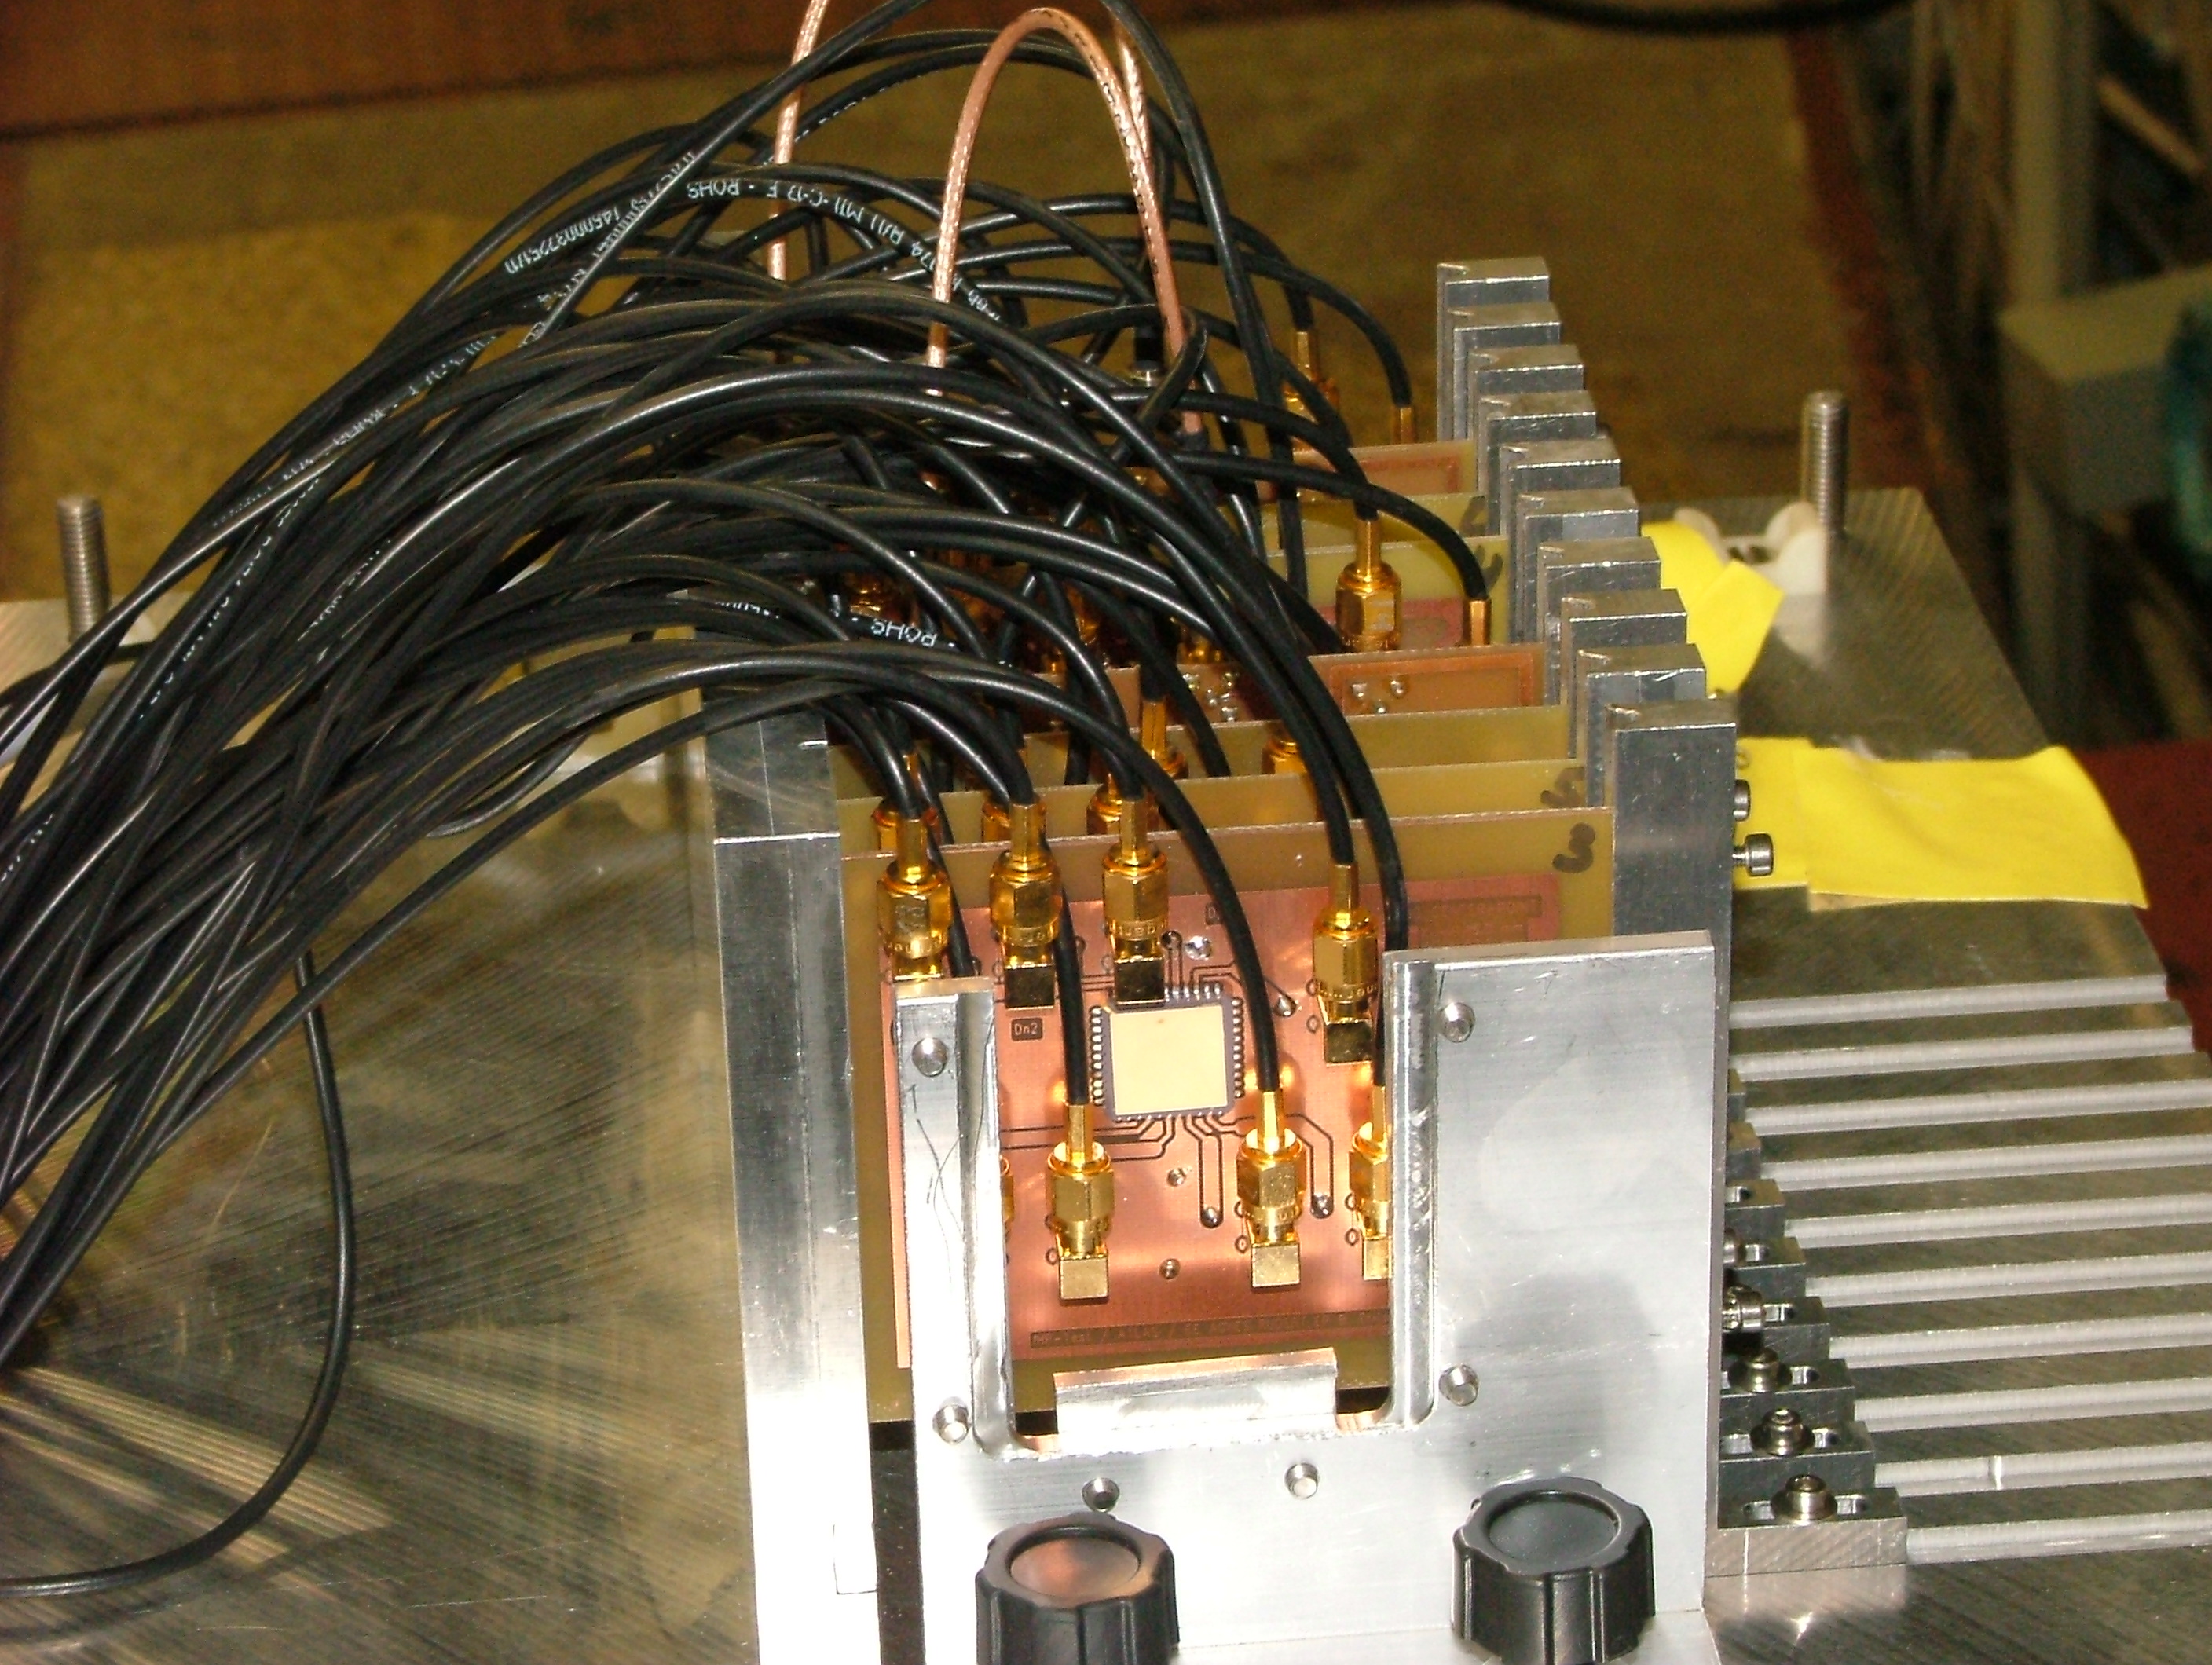
Prague03/2008:
A useful table which connects all the different names, types, etc..
Prague 03/2008: The
linearity test for the bb96 chip, devices 4 and 8 (system of 1 PA and a driver)
Prague 03/2008: Four measurements for each
device
Prague 03/2008: Different groups of same
devices
Prague 03/2008: Linearity: 1 device on 1
diagram, 3 diff. frequencies, two scales.
Prague 03/2008: Linearity: 1 device
on 1 diagram, 3 diff. frequencies, measurement 1 and 144.
Prague 03/2008: Different technologies
Prague 03/2008: Energy spectrum (after data received from P. Bem)
Prague 03/2008: S21 over S11 parameter for all 144 events (2- and
3-dimensional). New kind of simulation?
Prague 03/2008: First numerical results for the integrated flux at all 7
(P1-P8, P5 is free) slot positions.
Prague 03/2008: Different pictures
* 02.05.2008 - Prag03/2008: S21 and S11 for 20,
40 and 80 MHz (separated) over time and flux.
* 07.05.2008 - Prag03/2008: 1 device at 3 frequencies on the same diagram, s11 and s21 vs. time and flux.
* 16.05.2008 - Prag03/2008: 1 device at 3 frequencies on the same diagram: slope vs. flux.
* 16.05.2008 - Prag03/2008: Device 4 and 8, measured after the oscilloscope method: slope vs. flux.
* 22.06.2008 - Prag03-Munich/2008: Comparement of the s21 parameters for few devices at two time points - the last run (144) under irradiation and the state of those devices today, 3 months later. Are there some regenerations?
NEW! 12.07.2008 - Prag03-Munich/2008: Dev8, HEC syst.; slopes calculated over many ranges for the linearity curves. Two kind of fittings. NA- method.
NEW! 12.07.2008 - Prag03-Munich/2008: Dev8, HEC syst.; slopes calculated over some points for the linearity curves. Two kind of fittings. scope - method. The nonlinearity is obvious in any point.
You may download the analysis diagrams for the HEC2-second radiation test by
clicking themes on the left side of the screen. To print them in a way to
compare devices nicely use the option where you can print 2x4 or 2x3 or 2x2
diagrams on one page, taking care about the page numbering to catch the right
pictures on a certain page.
The linearity test for BB96: 9 diagrams inside the PDF. Description: Page 1-2:
the oscilloscope method for device 4 (1s1) and device 8 (2s1) in comparisment with the Dubna
measurement. Page 3 and 4: linearity measurement for these 2 devices measured
with the Networkanalyser (NA). page 5: both together
on the same page. Page 6-9 both methods and different zoomings
over the x- achsis.
Four measurements for each device: There are shown four different measurements
for each device which was working correctly (8 HEC1’s, 3 triquints,
8 IHP’s) (turn the pdfs in
your viewer for -90 degrees, if necessary)
Different groups of same devices: All HEC’s together
or all IHP’s or all triquints
together on one diagram. (turn the pdfs in your
viewer for -90 degrees if necessary)
The linearity test made with the Network analyser: For each device there are
linearity measurements (input current/output voltage) for three frequencies:
20MHz, 40MHz and 80MHz. First diagram for a certain device should always be the
same as the second, only the zoom-scale on the X-achsis
is different. Namely, the first diagram is shown under a scale up to 500 muA, and the second is a full-scale diagram.
The linearity test made with the Network analyser, part 2: For each device
there are linearity measurements (input current/output voltage) for three
frequencies: 20MHz, 40MHz and 80MHz and for the first and the 144. measurement.
Different technologies: On one diagram at the same scale you are able to
compare the linearity of three different used technologies: HEC CHIP BB96 (GaAs), Triquint transistor (GaAs, much smaller than HEC), IHP transistor (SiGe).
02.05.2008: All over flux: For a certain frequency (20, 40 or 80 MHz) there are
shown the changes in reflection (s11) and gain (s21) for certain groups of devices
over time and over flux. Else, there are sometimes zoomings
over the x or the y axis, if assumed that it is necessary. The complete flux
vs. time- diagram for all 8 (except 5) slots is also shown.